SINCE 1991
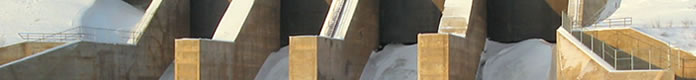
AquaCoustic Remote Technologies specializes in inspections of underwater structures such as trunk or mainline sewers, hydro dams, reservoirs, ports and bridge abutments using a wide range of technologies to create accurate condition assessments. AquaCoustic principals have over 30 years experience in assessing underwater conditions. Our clients include many major civil engineering firms and municipalities throughout North America.
Hydro dam survey deliverables
AquaCoustic can match deliverables to your needs. Unlike traditional survey techniques, the AquaCoustic system provides a sonar profile on-screen in real time, providing the ability to modify the survey on site.
Hydro dam and reservoir survey deliverables are defined prior to the survey taking place and may consist of all or some of the deliverables listed below.
Each survey is documented in a report that is provided as a hard copy and includes a DVD/CD-ROM with drawings, tables and any video in digital form. The report includes:
- Discussion of findings
- Spreadsheets and databases
- Photographs
- Site safety procedures
- Quality control procedures
- Daily field reports
|
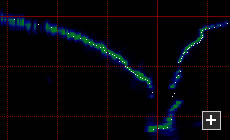
Selected sonar profiles. In some instances a specific sonar profile indicates additional information that may be helpful, or shows unexpected anomalies or features. For this reason selected profiles may be included in the report. |
 |
|
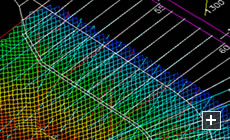
AutoCAD X,Y & Z data. The sonar profiles, the motion reference data and payout figures are recorded to our proprietary software. The software is also used for quality control and post processing, and outputs X,Y and Z files suitable for computer rendering. |
 |
|
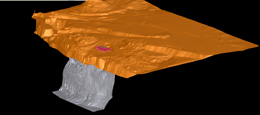
Sonar rendered as 3D images. AquaCoustic renders the sonar XYZ data using various CAD programs, this helps us illustrate such areas as:
|
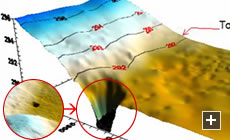 |
| Contour maps. | 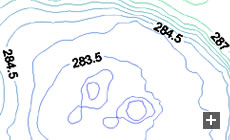 |
| Sun-illuminated data. | 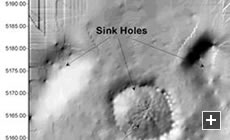 |
|
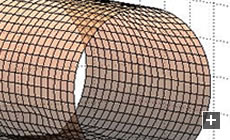
Scanning sonar output. Our scanning or side-scan sonar images the bottom or sides of structures. This may indicate type of material, scour patterns, position of construction joints, and type and size of debris. A mosaic of these images can be overlaid on a 3D wire mesh surface. |
 |
|
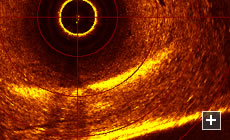
Tunnel inspection data. The sonar data is graphically displayed to show the percentage of flow restriction due to sedimentation or build-up. Tunnel diameter, volume of build-up, damage or other information is also provided as a table. This method is ideal for measuring areas such as:
|
 |
|
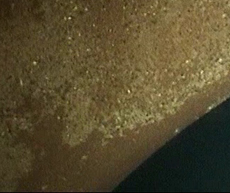
Video. A high resolution digital video camera can be used to capture images of scour areas, sink holes and trash racks. A system to introduce dye can be implemented to test for water currents, and recorded. For larger areas a remotely operated vehicle is used to gather video data. These digital video survey images can form part of the report, if required. |
 |
"We were very pleased with the data we got from the Intake site and it was instrumental in our design and analysis. I will keep Aquacoustic in mind for future projects..."
Todd Loar, P.E.